Housing affordability—or better put, the lack of affordability—has reached levels not seen since the height of the 2000s housing bubble, according to the Federal Reserve Bank of Atlanta. That will happen when mortgage rates jump from 3% to over 7% just after U.S. Home prices spiked over 41% during the Pandemic Housing Boom.
So, this historic deterioration in housing affordability must have driven home prices lower over the past year, right?
It’s a mixed bag.
Among the 400 largest metropolitan housing markets tracked by the seasonally adjusted Zillow Home Value Index, 174 markets in April were below their pandemic peak for local home prices. The other 226 markets had either climbed back to their pandemic peak, or set a higher peak altogether in April.
Western markets like Boise and San Francisco have seen local home prices fall 10% from their 2022 peak, while markets like Miami and Cincinnati just set new all-time highs for local home prices in April.
Real estate is local, however, and this bifurcated—and just straight-up weird—housing market really takes it to an extreme.
“The wild pandemic-era housing market made price growth trends more local than they had been since 2009,” wrote Taylor Marr, deputy chief economist at Redfin, in a report published this week. “The historic price-growth gap between San Francisco and Miami illustrates just how local the housing market remains, with the Bay Area losing homebuyers and South Florida attracting them.”
This bifurcated market, Marr says, “means it’s more important than ever to focus on local trends.”
Why has the housing market been so divided over the past year?
One reason: Western housing markets are simply more rate-sensitive. First, they have strained affordability after years of overheated home price growth, which makes them vulnerable to acute affordability strains whenever mortgage rates spike. Second, those Western markets have a high concentration of tech jobs, which are vulnerable whenever the Fed moves into inflation-fighting mode.
"The fact that Miami prices are holding up well despite the national pullback in homebuying suggests the relative popularity of Florida is here to stay. Even though some employees are returning to offices at least a few days a week, the pandemic has given many Americans much more freedom on where they choose to live—and a lot of them are choosing places where shelling out $1.5 million for a run-of-the-mill home isn’t the norm," wrote Marr.
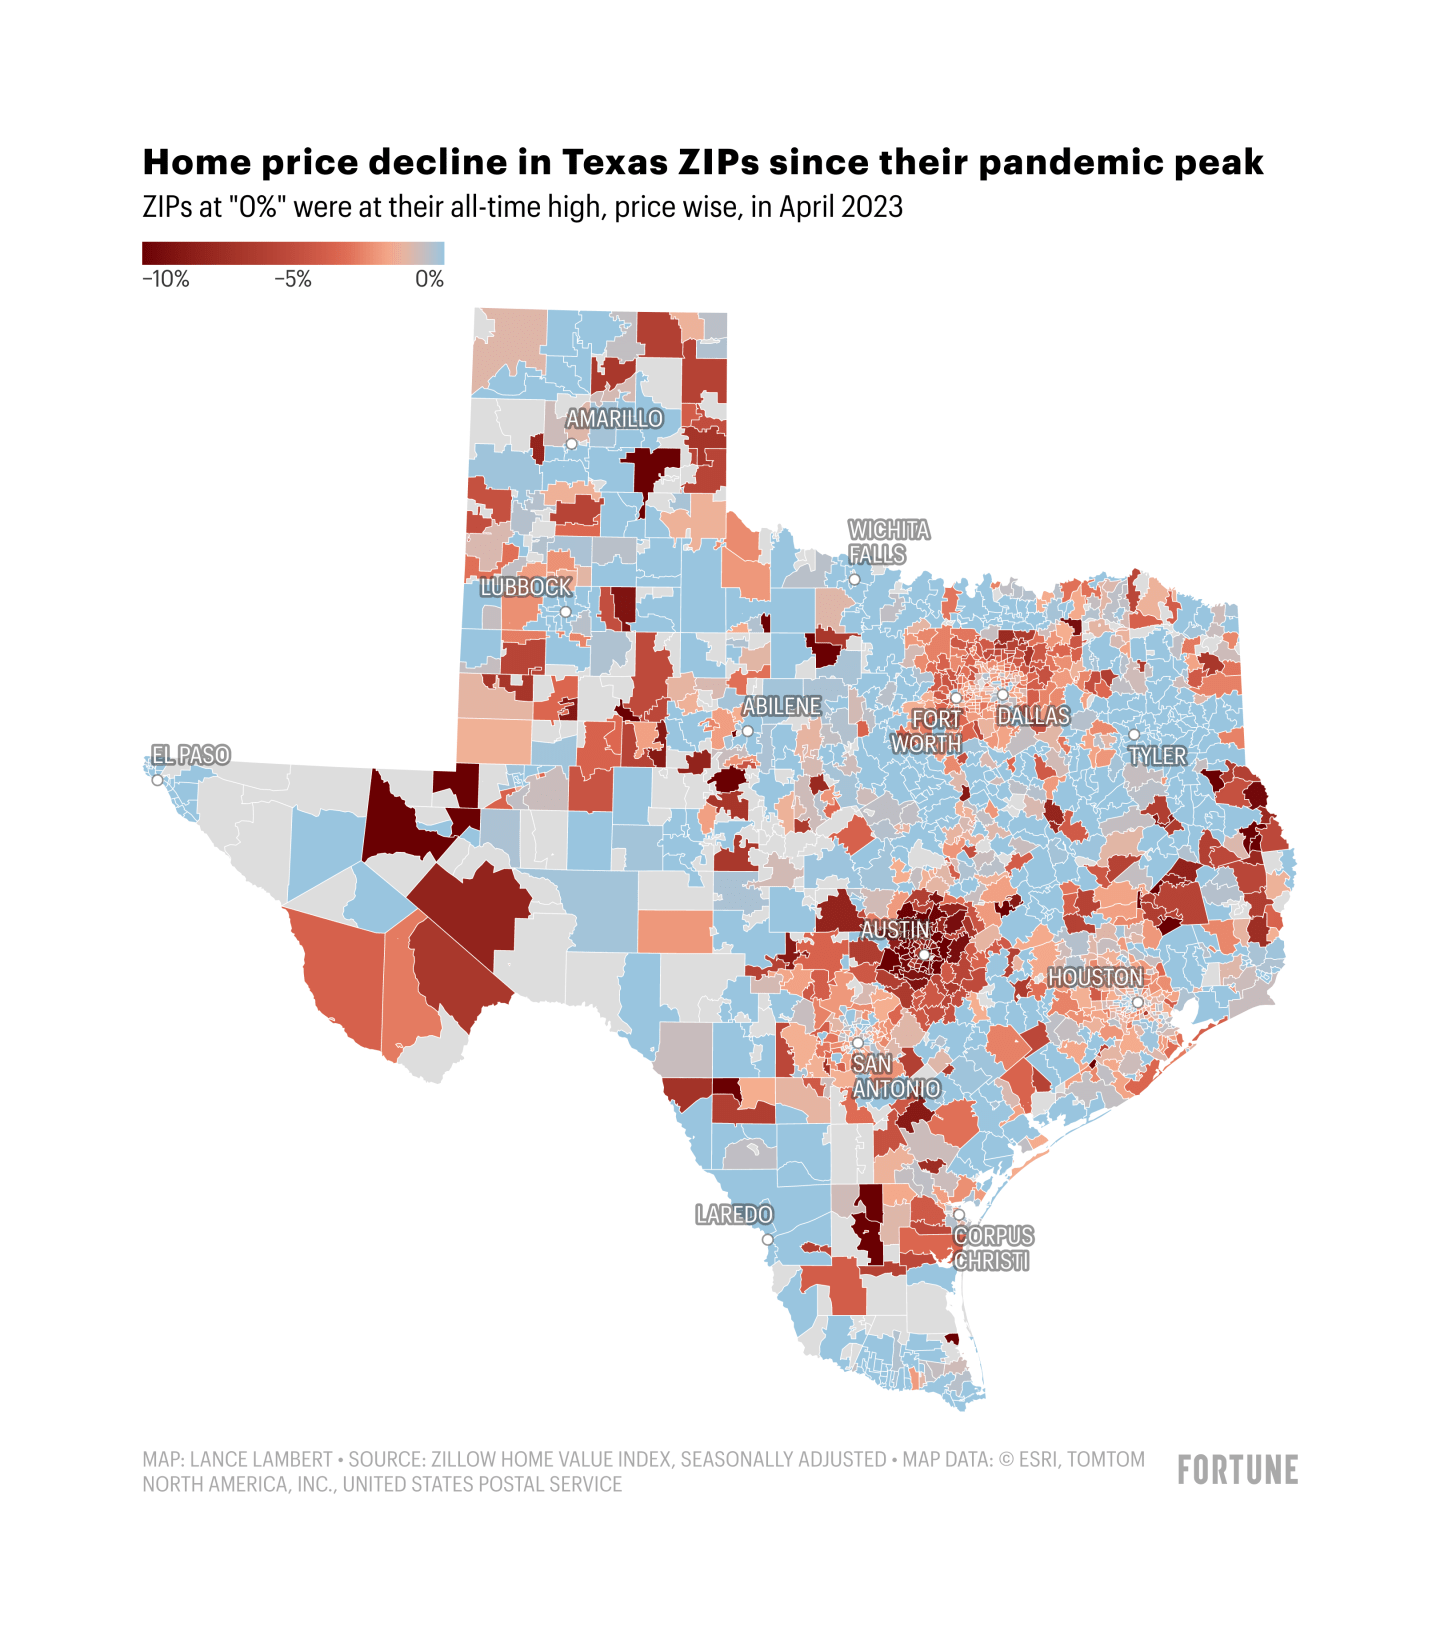
To better understand this bifurcated housing market, Coins2Day built 11 state-level maps using seasonally adjusted Zillow Home Value Index data. These maps show how ZIP code level home prices in April 2023 compared to the pandemic peak. If a particular ZIP code is shaded blue, it means local home prices in April 2023 were at their all-time high.
Among the 1,564 California ZIP codes tracked by Zillow, 98.5% are below their pandemic peak for local home prices; 1.5% of California ZIP codes were at their pandemic peak in April.
Among the 1,554 Texas ZIP codes tracked by Zillow, 69.6% are below their pandemic peak for local home prices, while 30.4% of Texas ZIP codes were at their pandemic peak price in April.
Among the 927 Florida ZIP codes tracked by Zillow, 76.2% are below their pandemic peak for local home prices, while 23.8% of Florida ZIP codes were at their pandemic peak price in April.
Among the 1,038 Ohio ZIP codes tracked by Zillow, 46% are below their pandemic peak for local home prices; 54% of Ohio ZIP codes were at their pandemic peak price in April.
Among the 722 North Carolina ZIP codes tracked by Zillow, 38.8% are below their pandemic peak for local home prices, while 61.2% of North Carolina ZIP codes were at their pandemic peak price in April.
Among the 303 Arizona ZIP codes tracked by Zillow, 90.1% are below their pandemic peak for local home prices, while 9.9% of Arizona ZIP codes were at their pandemic peak price in April.
Among the 782 Missouri ZIP codes tracked by Zillow, 30.4% are below their pandemic peak for local home prices; 69.6% of Missouri ZIP codes were at their pandemic peak price in April.
Among the 424 Maryland ZIP codes tracked by Zillow, 46% are below their pandemic peak for local home prices, while 54% of Maryland ZIP codes were at their pandemic peak price in April.
Among the 259 Connecticut ZIP codes tracked by Zillow, 25.1% are below their pandemic peak for local home prices, while 74.9% of Connecticut ZIP codes were at their pandemic peak price in April.
Among the 22 District of Columbia ZIP codes tracked by Zillow, one ZIP is below its pandemic peak for local home prices, while 21 District of Columbia ZIP codes were at their pandemic peak price in April.
Among the 230 Vermont ZIP codes tracked by Zillow, 13.5% were below their pandemic peak for local home prices, while 86.5% of Vermont ZIP codes were at their pandemic peak for local home prices in April.

Want more housing data? Follow me on Twitter at @NewsLambert.